
Market Prediction: When India-Pakistan tensions were at their peak just a few days back, the entire market was gripped with fear. Retail investors, especially new ones, liquidated their portfolios anticipating a massive correction. But in a surprising turn, after two days of ceasefire and easing geopolitical noise, the Indian stock market gave a strong bullish signal. Nifty opened with a massive gap-up of over 500 points and sustained buying momentum throughout the day. It didn’t just hold the gains — it ended the session at the day’s high.
Nifty surged nearly 900 points, Bank Nifty shot up 1800 points, and Sensex closed with an impressive 3000-point gain. This powerful candle is now being called a “Super Candle” by many technical analysts. The question arises — is this the beginning of a sustained uptrend or just a trap for retail participants? Let’s decode the data in detail.
Table of Contents
Nifty 50 Prediction: change it to match the title and start writing.
📌 Table of Contents
Click to jump directly to your desired section.
Market Overview – A Pause Before the Action
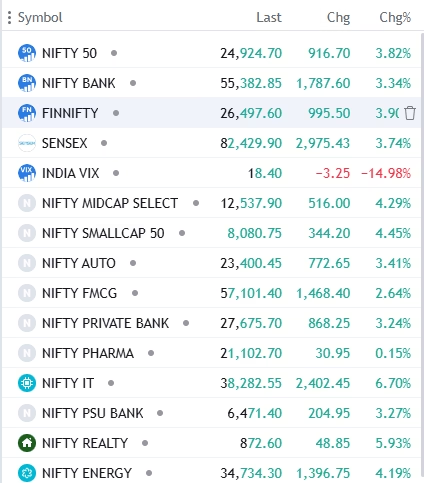
🔍 Nifty 50 Snapshot (3.82%)
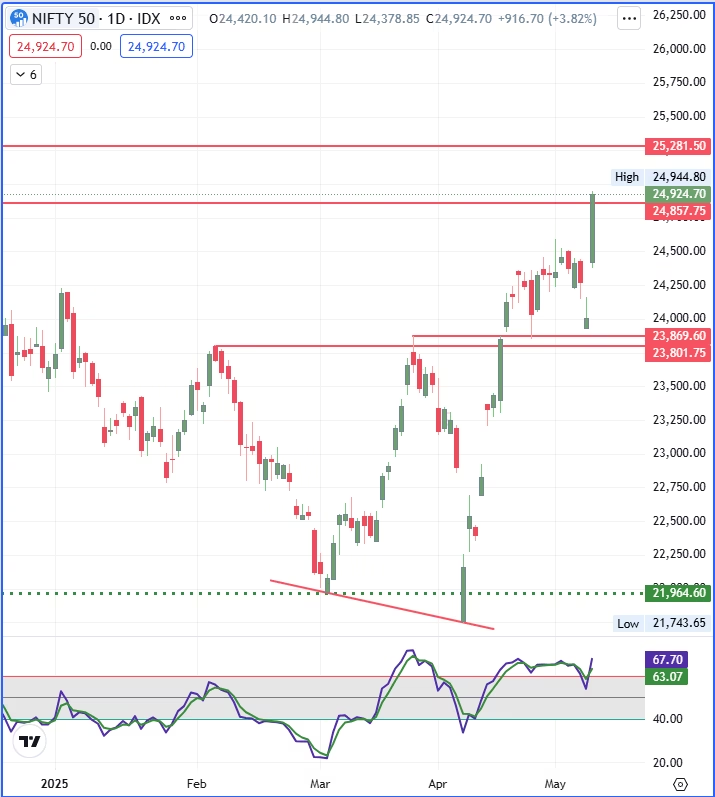
| Open | High | Low | Close |
| 24,420.10 | 24,944.80 | 24,378.85 | 24,924.70 |
📊 Market Breadth (Nifty 50)
| ADVANCED | FLAT (<0.25%) | DECLINES |
| 48 | 0 | 2 |
📈 Nifty Movers
| TOP GAINERS | GAIN % | TOP LOOSERS | LOSS % |
| ADANIENT | 7.73 % | INDUSINDBK | – 3.45 % |
| INFY | 7.69 % | SUNPHARMA | – 3.15 % |
🏦 Nifty Sectoral Performance
- All sectors closed in the green with solid gains.
- Most gained over 3%.
- IT with 6.70 % and Reality with 5.93 % are ther leaders.
- Pharma: Slight underperformance at +0.16 %
- Nifty Midcap, Small cap stocks runs more that Nifty 50.
🔍 Technical Analysis – Is This Pause Significant?
Key Levels:
- Support: 24,500, 24,600
- Resistance: 25,000, 25,280
Price Action:
- The market gave a clear breakout with strong volume.
- A massive bullish candle suggests follow-through buying might continue.
- Crossing today’s high will confirm further upside momentum.
RSI 14
- Hourly: RSI at 77; potential to stretch till 85.
- Daily: RSI at 67; first hurdle may come around 70.
📊 Open Interest (OI) Data
- Resistance: 25,000 CE ➜ 67.45 lakh OI
- Support: 24,800 PE ➜ 50 Lkh OI
🧮 OI Build-Up:
| Index | PRICE % | OI % | BUILDUP |
| NIFTY | 4.1% | 8.89 % | Long Buildup |
| BANK NIFTY | 3.61% | 10.45 % | Long Buildup |
| FINNIFTY | 4.18% | 4.71% | Long Buildup |
🌐 FII & DII Data (Will Update soon)
FII : +1,246.48 Cr. Buy in Cash
DII : +1,448.37 Cr. buy in Cash
- FII has bought +7,771.00 Cr. in Index Options too.
🧠 Market Prediction & Trade Plan
The market has given a textbook breakout. Whether this momentum continues will depend on global cues and institutional flows. Watch for follow-through above 25,000 – if that gets taken out with volume, expect 25,280 next. However, any gap-down tomorrow would be a cautionary sign.
📘 Key Learning from Today’s Market
- Major resistance/Support zones often break with powerful candles or gap-ups.
- Retailers get trapped either before or after such big moves if not planned.
- Super Candles are not random – they show strong institutional intent.
Want to Learn Option Trading or Struggling in option Buying. Check out our easy, simple and profitable Option Buying Strategy here.
📣 What’s Your Take?
Do you think ******?
💬 Drop your thoughts in the comment section!
Know Your Financial condition and prediction according to the Vadic method. It’s important and trending now days.. Click below.